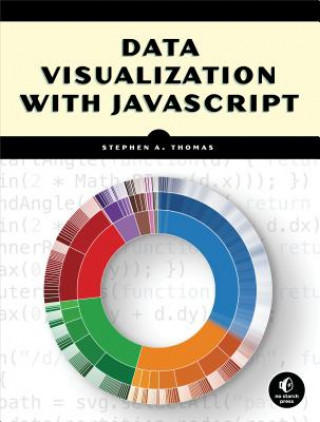
Code: 08021351
Data Visualization With Javascript
by Stephen Thomas
A well-designed data visualization makes information clear and captivating. Using color, animation, and interactive features, these graphics can make data come alive. Data Visualization with JavaScript shows you how to use a wide ... more
- Language:
 English
 - Binding: Paperback
- Number of pages: 384
Publisher: No Starch Press,US, 2015
- More about this

48.92 €
Availability:
50/50 We think title might be available. Upon your order we will do our best to get it within 6 weeks.
We search the world
You might also like
-

Brand Protection Online
229.13 € -5 % -

Learn CSS in One Day and Learn It Well (Includes Html5)
12.70 € -2 % -

Iron Kingdom
19.20 € -20 % -

Proposals for Printing a Very Curious Discourse, in Two Volumes in Quarto, Intitled Pseudologia Politike
16.20 € -

Five Minutes Answer to Paine's Letter to Genl. Washington.
15.10 € -19 % -

Mystery of M. Felix. a Novel.
23.80 € -18 % -

American Overstretch and the End of Hegemony
56.52 € -1 %
Give this book as a present today
- Order book and choose Gift Order.
- We will send you book gift voucher at once. You can give it out to anyone.
- Book will be send to donee, nothing more to care about.
Availability alert
Enter your e-mail address and once book will be available,
we will send you a message. It's that simple.
More about Data Visualization With Javascript
You get 124 loyalty points
 Book synopsis
A well-designed data visualization makes information clear and captivating. Using color, animation, and interactive features, these graphics can make data come alive. Data Visualization with JavaScript shows you how to use a wide range of JavaScript tools and libraries to make effective data visualizations. In Data Visualization with JavaScript, author Stephen A. Thomas takes you through all the design principles and programming techniques you need to start building your own data visualizations for your website-from the basic line chart to fully interactive network graphs and animated maps. Thomas provides full color, step-by-step instructions for creating specialized web graphics, such as charts that display stock market details in response to mouse movements, and a map that animates train routes to show the fastest option. Inside you'll also learn how to: Make charts that respond to user actions like mouse movements, clicks, zooming, and scrolling. Use an AJAX service to dynamically retrieve data for a chart Choose the right kind of visualization for a particular data set, and integrate the graphic into your website Pick the right tool for your visualization, from easy-to-use web components with everything built in, to powerful, highly customizable libraries like D3.js Manage large data sets in the web browser using Underscore.js Integrate data visualizations into a full web application No matter what your experience level as a web developer, Data Visualization with JavaScript will have you building beautiful and effective data visualizations in no time.
 Book details
Book category Books in English Computing & information technology Computer programming / software development Web programming
48.92 €
- Full title: Data Visualization With Javascript
- Author: Stephen Thomas
- Language:
 English
 - Binding: Paperback
- Number of pages: 384
- EAN: 9781593276058
- ISBN: 1593276052
- ID: 08021351
- Publisher: No Starch Press,US
- Weight: 866 g
- Dimensions: 180 × 238 × 32 mm
- Date of publishing: 15. March 2015
Trending among others
-

Effective Java
49.22 € -

Microservice Patterns
50.02 € -

Eloquent Javascript, 3rd Edition
35.61 € -11 % -

JavaScript for Kids - A Playful Introduction to Programming
29.61 € -16 % -

Spring Boot in Action
43.92 € -

Fluent Python
67.93 € -14 % -

Java Concurrency in Practice
63.73 € -

API Testing and Development with Postman
53.52 € -

Modern Java in Action
59.43 € -2 % -

JavaScript : The Good Parts
23.10 € -24 % -

Beyond The Basic Stuff With Python
29.41 € -14 % -

Gray Hat Python
35.71 € -11 % -

Angular for Business
37.91 € -24 % -

Effective Java
53.22 € -

Impractical Python Projects
28.01 € -28 % -

Well-Grounded Rubyist
49.92 € -10 % -

Spring Boot: Up and Running
49.52 € -24 % -

CSS Pocket Reference
23 € -24 % -

Design of Web APIs, The
48.72 € -2 % -

Learning Three.js - the JavaScript 3D Library for WebGL -
53.72 € -1 % -

Data Structures and Algorithms in Python
213.32 € -

Tomcat the Definitive Guide
30.51 € -24 % -

D3.js for the Impatient
37.91 € -24 % -

Java Web Services
41.51 € -

Modern Full-Stack Development
45.32 € -24 % -

JavaScript For Kids For Dummies
22.70 € -26 % -

Building Microservices
67.93 € -14 % -

HTML & CSS: Design and Build Websites
25.20 € -17 % -

Monolith to Microservices
42.12 € -24 % -

Effective Python
46.72 € -6 % -

Serious Python
28.51 € -17 % -

JavaScript from Beginner to Professional
41.71 € -

Learning Python
64.33 € -13 % -

JavaScript and JQuery - Interactive Front-End Web Development
31.11 € -22 % -

Introduction to Machine Learning with Python
65.43 € -1 % -

OCA / OCP Java SE 8 Programmer Practice Tests
33.51 € -16 % -

CSS Secrets
44.92 € -9 % -

Pro Angular
59.53 € -14 % -

Kotlin Design Patterns and Best Practices
46.22 € -

RESTful Web APIs
38.71 € -14 % -

HTML & CSS - Design and Build Websites
31.31 € -26 % -

Python for Microcontrollers: Getting Started with MicroPython
20.50 € -20 % -

Vert.x in Action
48.32 € -3 % -

Definitive Guide to HTML5 WebSocket
71.33 € -

Perl Pocket Reference 5e
10 € -28 % -

Optimizing Java
47.72 € -28 % -

Domain-Driven Design in PHP
51.52 € -

Murachs Java Servlets & JSP
57.02 € -

Architecting Angular Applications with Redux, RxJS, and NgRx
50.32 €
Collection points Bratislava a 2642 dalších
Copyright ©2008-24 najlacnejsie-knihy.sk All rights reservedPrivacyCookies


 15549 collection points
 Delivery 2.99 €
 02/210 210 99 (8-15.30h)